Thursday, October 25, 2012

The raising of oil price in America


The article posted by the famous magazine which is Economist, (http://www.economist.com/blogs/freeexchange/2012/02/oil), discussed about the raises of oil price affected by either the low production of oil or sudden growth of global demand for oil in America. The raises of oil price also positively affect the firms’ quantity of labour demanded in the market. The increases of oil price will increases the burden of American’s citizen income.

The first factor that increases the price of oil is the high population in America. Nowadays, the quantity demanded for oil increase because of the global population is increasing. The high population led to high global demand for oil and result in the raises in oil price. This will shift the oil demand curve in the market. From the figure 1, the equilibrium price is $100 per barrel as well as equilibrium quantity of oil demanded is 18 million barrels per day. When the population in American increase, the demand curve shifts rightward, while supply curve do not changes. The D* is the new demand curve in the market. The shift of demand curve to the right shows the increase in quantity demanded for oil from 18 to 19 million barrels per day. This also increases the price of oil from $ 100 to $120 per barrel due to an old equilibrium oil price shifts upward. Therefore, the population increase shift the demand curve to the right results in the increasing of the quantity of oil demanded as well as the raises in oil price.

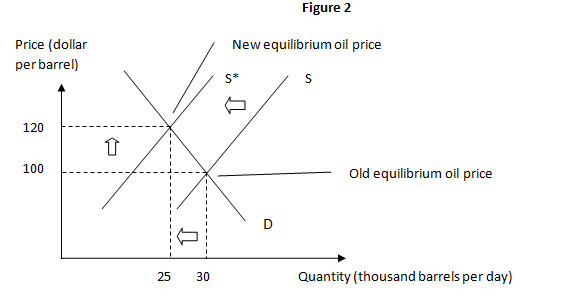
The second factor that affects to price of oil is the state of nature. Bad and dry weather causes the run dry of oil pipes in American. This result in the supply of oil decreases. Since the low production of oil is occurred, the price of oil tends to increase. In the law of change in supply, the supply of oil decrease will increase the oil price. Meanwhile, the quantity of oil supplied decreases in the market. From the figure 2 is showing that the supply of oil curve will shift leftward because of the run dry of oil pipes. Normally, the market equilibrium oil price is lies in $100 per barrel with the equilibrium quantity of 30 thousand barrels per day. After the oil is running dry in the oil pipes, the supply curve shift to the left because the natural event decrease the oil production. Meanwhile, the new supply curve, S*, causes the quantity of oil supplied decrease from 30 to 25 thousand barrels per day. Supply curve shifts leftward along the demand curve causes the new equilibrium oil price increase from $100 to $120 per barrel. Demand curve will not change in this event. Hence, the supply of oil decreases due to the natural event decrease the production of oil as well as increase the price of oil eventually.

In addition, the raise of oil price will not affect much on the quantity demand for oil. According to the law of elasticity of demand, quantity of oil demanded slightly decreases or increases, when the price rises or falls due to the oil is a natural item. Therefore, the oil demand curve is a highly inelastic demand but not perfectly. From the figure 3 demonstrates that the oil price raises up to $120 per barrel, but the quantity demand just only drop by 1 thousand from 26 to 25 thousand barrel per day.  Therefore, this graph shows the highly inelastic demand for oil but not perfectly.
On the other hand, the raising of oil price is affecting the firm’s quantity demand for labor in the market. The factor that increases the firms’ quantity demand for labor is the price of the firms’ output increases. In other words, the raise of oil price is the reason that firms increase their quantity of labor demanded. This is because the raise of oil price increases the value of marginal product of labor. For instances at the beginning, a firm has 1 worker to produce 5 barrel of oil per day. If the firm hires the second worker to produce 10 barrel of oil, thereby the marginal produce of that worker is 5 barrel of oil. If the price of oil is $100 per barrel, the value of marginal product is $500 which is $100 times 5 barrel of marginal oil. Meanwhile, if the wage rate is $20 per day, the firm earns the profit of $480 from the second worker.
In this case, when the oil price raise up to $120 per barrel, the value of marginal product of the second worker is $600 ($120 times 5 barrel of marginal oil). Therefore, the firm gains the extra profit of $580 which computed by the value of marginal product of second worker ($600) minus the wage rate of $20 per day for the second worker. When the firm earned extra profit, it intends to hire additional labor to produce additional produce. This brings the profit to that firm when the additional products is produced and sell it with higher price.
            I believe that the raising of the oil price brings benefit to those who are facing unemployment. The firms are willing to hire additional labor to produce additional products in order to gain extra profit. The extra profits reduce the total cost of the firms; thereby it is deserve to employ more workers in the production. Therefore, the increasing of oil price result in the reducing in unemployment as well as suppliers can earn the considerable profits. 

The Minimum Wage introduced in Malaysia


On the article that is posted by Malaysian Institute of Economic Research, (http://www.mier.org.my/newsarticles/archives/pdf/quah21_05_2012.pdf), the minimum wage introduced in Malaysia causes small businesses loss their profit because of the raising in operation cost. Therefore, they opposed the policy of minimum wage. Meanwhile, they employed less workers and result in surplus of labors. Minimum wage also applies in Thailand which has the same problem that is less quantity demands for labors by businesses.
Minimum wage is a policy that implement by government to increase the salary of labor in the market .This helps up the poor able to afford something necessity and avoid the problem of financial crisis. At the same time, this decreases the numbers of labor who are living below the poverty line in the society. The government of Malaysia intervenes into the labor market because they think the labor are getting too low the wages they worth to obtain. This is because some of the firms in Malaysia are offering the lower wages to their employees such as the salary below RM 700 for a month. Firms only concern about their profit gained and revenue. Firms calculate their total profit by using the total revenue deducts the total cost which includes fixed cost and variable cost. Rent expense, tax expense, insurances are a fixed cost, while labors’ salaries are the variable cost in the firms. Fixed cost is a cost that cannot be change or avoid whether or not the firm operates the business. In other word, this is the cost that remains the same output in the firm and not affect by production. On the other hand, variable cost will change with the production of the firm. Supplies, utilities bills, raw material, employees are relatively flexible to the firm to run the business. For instance, producers may use the cheaper raw materials or substitute to other resources that relatively cheaper to produce the products with the same output. Therefore, the firm also tends to reduce the employees’ wages to obtain the maximum profit due to low cost. Hence, this action of the firm triggers the intention of government to intervene in the market which is applying the minimum wage.
In the aspect of labor market, .minimum wage affects the labor demand and supply. In this case, household is the supply for labor, while businesses are the demand for labor. Labors are willing to supply their service to the firms when the wage rates increase. Before the minimum wage introduced in Malaysia, the average wage rates in the labor market is about RM 700 per month which is lower than the poverty line of RM763 per month.  In this case, let assume that the labor market equilibrium is RM 700. When the wage rate is more than RM 700 per month, there are a lot of labors are looking for jobs. In other words, the quantity supplied for labor is increasing.
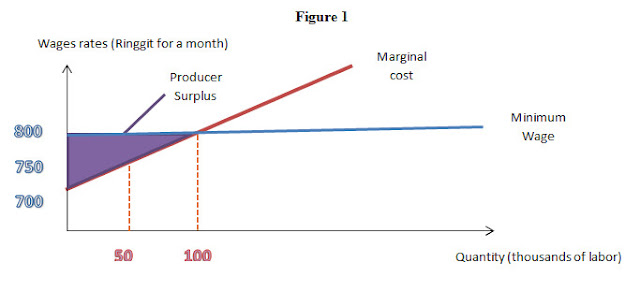
From the figure 1, it shows that when the minimum wage is imposed at RM 800 for a month, there are 100 of labor willing to provide and offer their services to the firms. This is because the minimum wage exceeds the marginal cost .Marginal cost in labor market is also supply for labors. Therefore, labors are gaining the producer surplus which lies on purple triangle area. If there are 50 of labor supplied to a firm, they gain RM 50 of producer surplus from the wage rate of RM750. That is why the quantity of labor supplied increased.
On the other hand, businesses want to hire the factors of production in lower cost to obtain maximum profit. Quantities of labor demanded by businesses rely on a certain wage rate with particular type of labor. The higher the wage rates, the lower the firms’ quantity demand for labor. In other word, the firms intend to pay low wage rates to their workers. Once the government implements the minimum wage in the labor market, businesses tend not to employ extra labor to work for them because it will increase the expense of firms. Just like I mention before, salary or wage expenses are the variable cost to the firms which will change with production. Hence, the minimum wage is not motivating the businesses to hire much more employees. Therefore, when the minimum wage is put into the labor market, the quantity of labor supplied will increase, while quantity of labor demanded by firms will decrease.

The government imposes the minimum wage will causes the inefficiency in the labor market. Minimum wage is set because the government think the labors are getting too low the wages; thereby put the wage rate up by using the price floor. When price floor is introduced, the firms cannot pay the wage rate that lower than price floor to their employees. From the figure 2 demonstrates that the minimum wage increases the quantities of labor supplied from 100 to 120 of labors. However, firms’ quantity demand for labor decreases from 100 to 80 labors. The wage rate of RM700 for a month is market equilibrium wage rate as well as equilibrium quantity of labor is 100 labors. When the quantity of labor supplied more than the quantity of labor demanded will cause surplus of labor in the market. In other words, surplus of labor means the unemployment. There are 80 thousands of labor are employed and 120 thousands of labors are available. Therefore, there are 40 thousands of labors facing the problem of unemployment. This is showing the inefficiency of minimum wage.

From figure 3 indicates that the minimum wage rate create an inefficient labor market. Figure 3 also demonstrates the firms’ surplus and labors’ surplus which are filling with the colour of pink and orange triangle area. From the area of blue square shows the potential loss in the market. In this area, labors are seeking for jobs and also known as jobs searching. The opportunity cost of the minimum wage is the potential loss from job search as well as it brings the loss to the society. At the same time, the firms intend to employ less of labors in the minimum wages, the quantity of labor employed will decreases from 100 to 80 thousands of labors. This result in the deadweight loss to occurs which is showing the area of black rectangle in the figure 3. Deadweight loss is created when the quantity of labor employed is less than the efficient quantity of labor employed. Therefore, this is the reason the inefficiency of the minimum wage is occurred in the labor market.
I think that the implementation of minimum wages in Malaysia is the wrong policy to help the labors who earned low wage in their jobs. This is because when the minimum wage imposed in labor market, businesses would not like to hire more employees due to increased total costs. Meanwhile, some of the firms may lay off their employees to make revenue. Eventually, there are a lot of labor are available to work. In other words, labors are also facing the problem of unemployment even worse than before the introduction of minimum wage. Therefore, I do not agree with the government to implement the minimum wage in Malaysia.

Wednesday, October 24, 2012

The impact of petrol price rises

          Nowadays, we can see many vehicles are moving on the road. Almost every vehicle is using petrol to generate energy for the vehicle. Petrol is necessary to power a vehicle to move. Besides, petrol is non-renewable resources and being scarce in the world. However, the amounts of car owners are increasing every year. Therefore, the demand for petrol is highly but not perfectly inelastic demand to drivers. It means drivers still head to the petrol station despite the price is increased.

          The article from 
'The Sun' a newspaper's website  (http://www.thesun.co.uk/sol/homepage/news/money/4491722/Petrol-will-hit-a-new-record-high-within-a-MONTH-motoring-chiefs-warn.htmlis mentioning about the price of petrol is rising within two month. It will hit the new highest price of petrol. Drivers have to spend more on petrol in the beginning of July. According to the law of demand, as the price increase, the quantity demanded with decrease. The quantity demanded is varies inversely with the price as long as other things remain the same or ceteris paribus.


           From the graph A above, point A (the black dotted line) is the price and quantity demanded before the price rises. P1 is the price of petrol that is before the increase of price, Q1 is the quantity demanded before the rising of price. After the price rises, it shows by point B (the red dotted line), the price of petrol increases from P1 to P2. The quantity demanded also increases as well, which is from Q1 to Q2. Since petrol is relatively inelastic demand, the demand curve is steeper. Therefore, the percentage of change in quantity demanded is less than the percentage of change in price. In other words, the quantity demanded will have a little change, even though there is a high degree of change in price. Price inelastic demand is occurring if the goods or services are less substitution and it is necessity.


            The change in total revenue is depending on the price elasticity of demand for the product. From the graph B above, the maximum total revenue is the price when the product is unit elastic demand. The arc on the left side of maximum total revenue (point A) is the change of total revenue when the price is changing on elastic demand product. In contrast, the arc on the right side of the maximum total revenue (point A) is the change of total revenue when the price is changing on inelastic demand product. The total revenue of elastic demand product increase when the price decrease; However, the total revenue of the inelastic demand product decrease when price decrease. Hence, as the demand for petrol is inelastic, the total revenue of suppliers will increase when the price is increasing.


          Besides that, the law of supply is when the price increase; the quantity supplied will increase. The quantity supplied will increase if the price raises and fall if the price falls, as long as other things do not change or ceteris paribus. From the graph C above, point A (the black dotted line) is the price and quantity supplied before the price rises. P1 is the price of petrol that is before the increase of price, Q1 is the quantity supplied before the increase of price. After the price rises, it shows by point B (the red dotted line), the price of petrol increases from P1 to P2. The quantity supplied will also increase from Q1 to Q2. The quantity supplied for petrol increases because the price rises and this allows the suppliers to gain more revenue. Surplus may occur because suppliers are trying to supply more while there are decreasing in demand. This will occur overproduction which is one type of market failure.

          Furthermore, the increasing of petrol price also will affect the investment of government in public transport. When the price of petrol rises, drivers are spending more money on petrol. Thus, consumers may prefer to use public transport rather than use their own car. The quantity demanded for public transport will increase. In order to prevent shortage in public transport, the government may spend more on the public transport to increase quantity supplied, for example purchase more buses and hire more bus driver. As there is more public transport supplied by government, the quantity supplied of public transport increases. Therefore, the quantity supplied of public transport will increase to meet the quantity demanded of public transport. Malaysia government is a good example in this situation. Malaysia government establish a company named as Rapid KL. It is a government-owned company that is operating the light rail transit (LRT), bus station and monorail in Kuala Lumpur, Malaysia. It helps to meet the high quantity demanded for public transport in Kuala Lumpur. This can reduce the shortage of public transport and smooth the transportation system.

          Ron 95 and Ron 97 are the two types of petrol that are standard at all petrol stations in Malaysia. The difference of the both types of petrol is the degree of energy that can be produced. The degree of energy produce by Ron 97 is more than Ron 95, so Ron 97 is more expensive. As petrol price rises, some drivers who are using Ron 97 may switch to use Ron 95 as substitution of Ron 97 in order to save money. The quantity demanded of Ron 95 will increase as more drivers are willing to use Ron 95. As the price of petrol is rising, the suppliers of petrol are willing to supply more Ron 95 to gain more revenue as well as meet the quantity demanded. Therefore, the quantity supplied of Ron 95 will increase. On the other hand, the quantity demand of Ron 97 will decrease. Since the price is rising and the demand for Ron 97 still exists, the suppliers of petrol will increase the production of Ron 97 to increase their revenue. However, the quantity demanded of Ron 97 will decrease because the price rises and substitution of Ron 95.

         In my opinion, I think the government should remove the subsidies on the petrol and increase the petrol price. As price of petrol is higher, the quantity demanded of petrol will decrease. Therefore, this will lead to decrease the usage of petrol and reduce the greenhouse gases in the world. Thus, we can life in a better quality of environment.

The price rising of lower-priced housing

        Shelter is one of the necessities to meet our physiological needs. This article from 'The New York Times' a newspaper's website (http://www.nytimes.com/2012/09/26/business/home-prices-climb-again.html)  is mentioning about the lower-priced housing is rising faster than the middle-priced housing and upper-priced housing. The demand for a shelter is highly but not perfectly inelastic, which mean the demand for housing will not have affect so much while the price of housing have a highly increases.    

        Lower-priced housing is relatively inelastic for the single who is lower-income classes because they only can afford the selling price and the rent of lower-priced housing. They can decide whether to purchase it or rent it. Single who is lower-income classes may prefer to rent a house rather than purchase it. They may also share a house with the other who is willing to share the rent. This can decrease their expenditure on rent expense. Furthermore, some of the single who is middle-income classes may want to purchase lower-priced housing before, yet they may purchase the middle-priced housing as a substitution for the lower-priced housing as the price of lower-priced housing is rising.  


         According to the law of demand, as the price increase, the quantity demanded will decrease. The quantity demanded is varies inversely with the price as long as other things remain the same or ceteris paribus. The quantity demanded for lower-priced housing decreases as single who is lower-income classes are sharing their house with others. From the graph A above, when the price is rising which is from P1 to P2, the quantity demanded is decreasing form Q1 to Q2, which is from point A (the black dotted line) to point B (the red dotted line). As the lower-priced housing is relatively inelastic for single who is lower-income classes, the quantity demanded will not have high percentage of decline compared with the price. In other words, the percentage of change in quantity demanded is less than the percentage of change in price.


         Besides that, the law of supply is when the price increase; the quantity supplied will increase. The quantity supplied will increase if the price raises and fall if the price falls, as long as other things do not change or ceteris paribus. As the price of lower-priced housing is rising, the suppliers of lower-priced housing are willing to supply more and more houses to gain more revenue. The quantity supplied of lower-priced housing will increase as the price increases. From the graph B above, the price increases from P1 to P2, the quantity supplied also increases from Q1 to Q2. In other words, it is from point A (the black dotted line) to point B (the red dotted line). Consequently, there will be a little surplus on lower-priced housing in the market as the quantity supplied of lower-priced housing is more than the quantity demanded of lower-priced housing.

        If the price of houses increase severely in western country, the government may put in a rent ceiling to make the rent lower, so the lower-income classes can afford the rent of housing. One of the good examples is the rent ceiling in the New York, USA. As the price of houses rises, the rent of houses will increase as well. Once the government put in the rent ceiling, the rent of houses will be more affordable for the lower-income classes and middle-income classes. Nevertheless, rent ceiling may not achieve what the government expected. The rent ceiling may not benefit directly for those who are lower-income classes and middle-income classes.


        From the graph C above, the price and the quantity demanded before the rent ceiling is putting in is marked as P1 and Q1 respectively. After the rent ceiling (P2) is putting in, the quantity demanded will increase from Q1 to Q3 as the rent is cheaper. However, the supplier may not want to supply more when the rent is lower as the revenue is lesser. The quantity supplied will decrease from Q1 to Q2. The quantity supplied will not meet the quantity demanded. In this case, when the quantity demanded is increasing and the quantity supplied is decreasing, a severely shortage will occur. This will also cause the underproduction which is a type of market failure. Hence, they will be a social loss or deadweight loss (area shaded with gray color). The consumer surplus and producer surplus will shrink. It will also have a potential loss from searching activity (area shaded with purple color) and increase in the opportunity cost. Moreover, this will only benefit the black market. The supplier who do not willing to supply at the price ceiling may want to supply to the black market as higher revenue will be gained. Some business man may acquire a big amount of lower-priced housing and sell them with higher price (P3) in the black market to gain a higher profit. Consequently, this will increase the opportunity cost of the consumers.


        In Malaysia, the housing price is increasing since 20th century. The government in Malaysia has not put in the price ceiling. The government announced the 1Malaysia Housing Programme (PR1MA) which is a programme that constructs affordable housing for middle-income earners. This programme directly benefited to the middle-income classes. The requirement for the programme is the individual must be Malaysian. This programme is only for the individuals or the families with monthly income of between RM 2,500 to RM 7,500 which is middle-income classes. This will effectively benefit the targeted population. However, in my opinion, I think this programme will be better if the government adjust the requirement for the individual or families with monthly income of below RM 5,000. Therefore, this can benefit not only middle-income classes, but also lower-income classes. I think government should provide more welfare for lower-income classes to prevent a big gap between lower-income classes and middle-income classes.


        Above is the comparison of strategy on increasing of housing price in USA and Malaysia. Both countries’ strategies are not effectively to confront the price rising of the lower-priced housing. They are not effectively on helping the lower-income classes and middle-income classes. However, I would choose the 1Malaysia Housing Programme (PR1MA) rather than the price ceiling. It is because PR1MA have a targeted population, while rent ceiling didn’t have.

Chicken prices 2012


Chicken is the world’s primary source of animal protein and a healthy alternative to red meat.  It’s the most common type of poultry in the world and rank as most popular meat in every country including US and Australia. By the way in the year of 2011 Australia, chicken is a favorite protein for Australian, who eat on average 43 kilograms a year, and that is double than what they are consume 30 years ago. Besides, the result had shown that chicken meat consumption per capita now ahead of that beef and is predicted to increase further over coming years.


Referring to the article news about Australia ( http://www.abc.net.au/news/2012-07-27/chicken-prices-may-double-from-next-week/4160324) it stated that Australian landscape is dominated by seven large producers and basically it stated Australian consumer about need to pay a lot more for the chicken price with a least the prices will double up in after few weeks. The reason of chicken price producers are bumping up their prices in Australia is because of the cost of feed grain soars as the drought in the United States. Australian said that grain prices have increased significantly over last three months was because the heavy drought impacts on the US corn crop. Besides, one of the producers mentioned the price of chicken could rise for as long as nine months because they are going to have higher grain costs at least 9-10 months and expected the grain price will push the chicken meat production cost up by 5%, however, a 5% is the officially forecast, the Australia’s largest meat producer stated its price may need to rise by 40%.

Grain is the cost to produce chicken. Usually chicken eat grains to survive but when the price of grains increase, chicken meat will affected from it. It means the price of grains increasing means the cost of production increasing, obviously it’s a burden for producers; therefore, producers will decrease the supply for chicken. When the supply of chicken meat decreasing at the same time demand of it remains constants, there will be quantity demand more than quantity supply; hence, shortage happens in the market eventually price of chicken meat rapid growth.

There are many causes can lead to shortage of chicken in the market not only because of the cost of production increase but also festival seasons. During festival seasons such as Chinese New Year, Mid-Autumn festival, Christmas and so on, many people will tend to buy chicken meat to celebrate as chicken is the most common meat around the world. Hence, chicken meat will be in high demand not because of the price itself, but festivals even though the price of chicken meat is high but it won’t really affect the demand for chicken meat.

Assume that consumers are not willing to pay at the high price of chicken meat; they will switch off white meat, the chicken, to red meat since they are both substituted goods. Imagine if there is an oversupply of Australian red meat in the market, consumers will tend to go over to the red meat and that will take up the slack and the demand for chicken will drop off because of this, so the price of chicken should drop back normal after while. It’s a good way to solve the shortage in the market.


Once again, it is because the price of chicken meat increasing, some people could afford the high price; therefore, people will switch to substitute goods. Quantity demand for chicken will starts decreasing due to consumers swing to substitute goods such as red meat. Based on the graph above, it shows the substitute goods between chicken meat and red meat. When chicken meat increases the price from P1 to P2, quantity demand obviously drop from Q1 to Q2. After that, consumer switch to red meat, demand for red meat will increasing and the demand curve will shift to the right. It proves that both of them are substitute goods and will affect by the demand and supply in the market.

In this situation, government needs to take action to solve the problems. In order to maintain the price level of the chicken meat in market, price ceiling is the way the protect consumers. Price ceiling is set below the market price, once price ceiling sets by government, sellers cannot sell over the price level.

Based on the graph above, if government impose price ceiling in the market, it will below the initial market price. Therefore, quantity demand for chicken meat will increase from Q* to Qd, because it is cheaper than the price before, so everyone might be able to buy chicken meat in that level of price, however, quantity supply for chicken will decrease from Q* to Qs because either they cannot earn much profit as last time or cost of production is higher. When quantity demand is more than quantity supply, shortage will happens in this situation. Although price ceiling can protect consumers, there is still shortage happens in the market; it shows that doesn’t really help to solve the problem by using price ceiling. 

Let’s say if government apply price ceiling, they can protect consumers but there would be unfair to producers also because they might need to sell the price which will be lower than the cost of production, they got no profit to earn and cannot cover the cost of production as well. At the same time they have no power to control the price itself, so they decrease their output. Therefore, government impose price ceiling is not the best way to overcome the situation. In my opinion, government can give subsidies to producers of chicken meat to cover up to lost, therefore, it can encourage producers to produce more chicken meat in order to overcome the shortage situation.

Fish and seafood prices in 2011


Fish is a daily food item for many Malaysians and it can served in many different sauces as well as can eaten by the Malay, Chinese and Indian in our country. Based on research, the per capita consumption of fish and seafood is estimated to be around 30-35kg in the country. By the way in the year of 2011 Malaysia shown that population was around 30million therefore, it proves that the total demand for fish is a lot.
Based on the article of fish and seafood prices from Kuching, Malaysia 2011, ( http://www.freemalaysiatoday.com/category/nation/2011/06/06/fish-seafood-prices-to-skyrocket/) it shows that the government fuel subsidies in local fishing industry is an important support mechanism for fishing industry in order to protect fisherman from rising fuel prices. In addition, fuel subsidies can help to stabilize the retail price of fish & seafood in the market as well as consequently reducing the impact of high fuel prices on fishermen’s income, however, government stated they wanted to abolish fuel subsidies and the decision of government had made has lead to many negative effects. Malaysia trawler operators claimed that by cutting the fuel subsidies, they need to bear additional cost RM10, 000 per trip; obviously they cannot afford the fuel price and explained that its decision to abolish the fuel subsidies will be the death of the local fishing industry. Besides, government refused to listen to their problems; hence, the fishermen who operate C2 trawlers nationwide were protest and launch a boycott to against the government’s decision in order to pull back their fuel subsidies in Kuching.

If the government really abrogates fuel subsidies to fishing industry, there will have some big changes in the market, demand and supply. As the government not giving fuel subsidies, there is a high cost of production for fish and seafood and it will become a burden for fishermen. As the cost of production goes up, producers are not willing to supply more because there is not much profit can earns, therefore supply for both will be decreasing. When supply decrease, there is a scarcity in fish and seafood market at the same time demand remain the same level, When the quantity supply more than quantity demands, shortage occur and eventually the price of the fish and seafood will rising rapidly because there is lack of fish and seafood. After that, since consumer cannot afford the price of the fish and seafood at the high level gradually the quantity of fish and seafood will decrease slowly.

Based on the graph above, it shows that decrease in supply and demand. Due to the reason of decreasing in supply of high cost of production, the equilibrium in the market will create a new equilibrium. For example, the initial equilibrium ( E0) above at the price of P and quantity of Q. When the supply decrease at the same time demand remains constant, the supply curve will shift to the left to S1 and creates a new equilibrium which is E1. When the quantity supply is more than quantity demand, shortage occurs in the market. But as the time goes on, consumer cannot afford at the Price 1, eventually demand for fish and seafood will start decreasing slowly and demand curve will starts to move to the left D1 eventually the price from P1 will move down to P again, therefore, S1 and D1 will creates another equilibrium ( E2 ) in future.

       In my opinion, there are few reasons can cause the price of fish and seafood increase, not only because of government cut down the subsidies, it also can be the seasonal effects on the fish and seafood price, for example monsoon or rainy season can drives the fish price up. The more it rains the higher price of fish and seafood consumer need to pay because fisherman would not be able to go out fishing during rainy season, it is dangerous for them. Therefore, when shortage occurs, local fish retail price hard to maintain and gradually price will push up by all these reasons.

On the other hand, government intervention should take action in this situation. If government might wants to protect the fishermen in local fishing industry, they can apply price floor which is set the price at minimum price level and above the market price. Therefore, fishermen can sells fish in the reasonable price which are buyers are willing to sell in the level of price and consumers are willing to buy in the level of price as well. By the way, if fish and seafood force to push up in the high price, is it fair to consumers? It would be a burden for lower income person because they cannot afford the high price of fish and seafood also fish is consider as a daily meal for Malaysian. 

Assume that, if the price of fish and seafood keep on increasing, demand for fish and seafood will decrease. As meat is consider as daily meal as well, when the price of fish and seafood increase, consumer will starts looking for substitute goods and meat are such as beef, lamb and chicken. When the price of fish and seafood increasing, demand for chicken as substitute goods will starts increasing, and then supply for chicken will increase as well because producers want to earn profits at this timing, so the price of chicken will eventually goes up.

Last but not the least, in my opinion, competition is good for fishing industry, they might compete with foreign industry and improve themselves by using more high technology to increase their output, however, as many foreign industry in the fishing market, the local infant fishing industry would be hard to survive in the domestic market because those infant industries are still in an early stage, their market are still small, so, government should protect them until they are able to take advantages of the economic scale. In order to protect our local fishing industry, government can reduce their fuel subsidies for foreign trawlers so there would be lesser competitive in the market as well as remain the price of fish and seafood in the market eventually local producers and consumers could enjoy the benefits.

Sugar Subsidies and Diabetics

          According to the news which published at The Star (http://thestar.com.my/news/story.asp?file=/2012/9/28/budget/20120928194432&sec=budget) Malaysia budget 2013 was published on 28th September 2012, there is a lot of policy financial position changed, the decrease in sugar subsidy is one of the contestable changing that I’m going to discuss. Subsidy is the payment of a good that government made for producer it also means that the government enter the market and making effect to it. Before discussing the said article, we have to know the relationship among the supply, demand and price of sugar that was not affect by subsidy. Below is the supply and demand relation chart that illustrated before government entered.
           The red line is representing the demand of sugar, it is more inclined toward vertical which express sugar is an inelastic goods, as sugar is a necessity to consumer. The blue line is representing the sugar’s supply. The green line representing the equilibrium price and quantity which both consumer and supplier are satisfy with. As we known, the definition of demand is involve the ability to buy it, so there may a huge number of people can’t afford the price and decided to decrease the using of it, this is the phenomenon of the falling of a country. As a result government provided subsidy to improve the supply and try to decrease the market price. Below is the chart after the government provided subsidy.
            Different from the first chart, the supply curve moved rightward as the cost of production had been shared with government and the demand curve remaining the same. The new equilibrium price is lower than before government provided subsidy, so the price will be lower and the quantity of demand increase, or we can see that, more national is able to bear the price of sugar and sugar producer can produce more sugar with a lower cost, from government vision is the development of a country, both producer and national get the benefit from subsidy.

          However, is the sugar subsidy really benefited to our country? Promulgate of a subsidy given is actually encouraging national to have more sugar, this can also cause the increasing of diabetes rate which is harmful for our country. According to the Euromonitor International report, 5.9% of 100,000 Malaysians have suffering in diabetes. Euromonitor International from International Labour Organisation also reported that, before subsidy decrease which is remained 54cents per kilogramme, the cost of producing a kilogramme of sugar is RM1.6, and the retail price is RM2.30 per kilogramme, government shared 54cents of cost of production, sugar supplier has only cover RM1.06 per kilogramme. From the vision of supplier, every kilogramme may bring another more 54cents revenue than before, as human behaviour, supplier may provide more sugar in market to maximize their benefit. As a result, in the Malaysia Budget’ 2013 the decrease of the subsidy of sugar is because our government try to decrease the diabetes rate by dropped sugar’s quantity of demand and supply in the market. 

        Yet, does the decrease of sugar subsidy really help in the diabetes? From chart 3 we are able to understand the effect of a decrease of subsidy. Different from chart 2, a decrease of subsidy forced the supply move leftward as the cost of production increased, supplier less willing to produce more sugar, and as the new equilibrium price increased, the quantity of demand decreased. But if we take notice that, the proportion of the changing in price and quantity of demand, we can found that, the price is highly increased but the quantity of demand had only decreased by a few. From the new chart, we can also make a conclude that, if the decreasing of sugar subsidy is point at against for the diabetes, it may not be so efficiently, it doesn’t means it doesn’t work at all, it just doesn’t work efficiently
            As we known, sugar is a necessity that we are taking every single day, so its property of elastic is definitely inelastic. As an inelastic goods, prices are not the main issue to effect the quantity of demand, even the price raise until RM8 per kilogram, people are still purchasing on it, because people are surviving on it. So, government may drop the diabetes rate by other way which is more efficiently than raising the price of sugar. 

            Moreover, at the side of relative good supply, an increasing of the sugar’s price will also causes the cost of producing confectionery to be increased too. As a result, confectionery producers have to raise the price to cover the new cost of production. But, before the new budget process, confectionery supplier knew the future price of production must be increased, and sugar is the good that can be stored, they will purchase or even hide more sugar to maintain the cost of production. After budget processed, the price of confectionery product raised, those producers who stocked sugar with earlier price will get the higher revenue in the end. For example, A producer has 2tons of sugar inventories, they decided to postpone the supply after budget processed, A can sell his product with a higher price and with a lower cost. As a result, the demand of sugar will increase in a short-term until the budget processed, and the confectionery supply in the future market will remain the same even higher, that means the source to cause diabetes will increase in a short term.

      However, it may also influence the overproduction to confectionery. Once confectionery supplier decided to product more, the confectionery in the market may over the quantity of demand, as a result it may occur “deadweight loss” which is a social loss.

       When the quantity of supply is too high, supplier may drop the price to increase the market occupancy to ensure the benefit. When the price get lower, the quantity of demand will increase which is the effect of equilibrium, people take more confectionery than before as they think the price fall. At a certain point, controlling of diabetes became counterproductive.

        In a nutshell, decreasing of sugar subsidy may not the efficiency way to drop the rate of diabetes. In my opinion, government can control diabetes rate by other way which is more efficiency such as provide the relative information/knowledge by education, advertising or creating campaign to national or from commencer way is straight control the amount of sugar/confectionery in the market, the decreasing of sugar subsidy is increase burden to national rather than dropping of diabetes rate.